
A HAPPY NEW YEAR.
First of all, I would like to wish everyone ‘ A Happy New Year’. As we start the new year, let us pray that it will be an amazing one. May peace, happiness, and more smiles and loads of love spread across the world.
We need to keep safe and healthy as the pandemic Covid 19 is not showing signs of slowing down.

By staying healthy, we can concentrate on our goals and protect our wealth.
Now, what your BMI does not tell you about your state of health is worth thinking about. As the new year dawns, the goal of achieving a healthy lifestyle may be included in your resolutions.
By now we are familiar with the BMI system. Your doctor may have a BMI chart in his clinic next to the weight chart for a quick reference.
But of late there is a debate whether the BMI is a true measure of your health. A healthy weight, however, remains an important factor in monitoring health. . But two people can have the same BMI, but wildly different states of health. So, why is this so?
Maintaining a healthy weight is important, but there are additional factors that further define being healthy.
WHAT IS BMI?

From my previous post on BMI, which is the number calculated using certain ratios of height and weight. It is more a health tool for public health to gauge obesity. Researchers use it as a tool to calculate an overall average weight of a population, not of individuals. BMI does not consider genetic differences. Two people of the same height and weight will have the same BMI. One of them may regularly exercise and does weight-lifting leading to a relatively low percentage of body fat. The other has a sedentary lifestyle risk factor and has a high percentage of body fat. But their weights are the same.
Their BMI being equal, does not justify and reflect the state of health for one of them. The active person could be in an overweight classification. The ‘ couch potato’ person would be feeling a sense of good health.
BMI does not measure bone structure, muscle mass, fitness level or, what type of fat a person has.
Hence, for individuals, additional factors need to be considered.
BMI will still be used as a reference tool and will not be replaced any time soon. Many doctors and health professionals have started to find better ways to assess a person’s health. Health professionals have started to use different methods to assess a person’s health, with or without BMI.
In the U.S., the average BMI ranges between 24 and 27. Almost half of the population falls into the “pre-obesity” category. It is not a hard sell that many people in the U.S. could be overweight, But is it an actual reflection of health? A fit, healthy person with more muscle and less fat could still be lumped into an unhealthy BMI category.
HEALTH PROFESSIONALS USE OTHER HEALTH MARKERS TO ASSESS A PERSON’S STATE OF HEALTH
Health is thus much more than a single BMI number calculation or marker. Humans are three-dimensional and thus would require multiple considerations to assess their state of health.
Waist Circumference or Waist-to-Hip Ratio
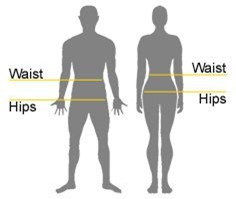
The waist-to-hip ratio, also known as the waist-hip ratio, is the circumference of the waist divided by the circumference of the hips. What does a person’s waist-to-hip ratio say about their health?
The waist-to-hip ratio (WHR) is a quick measure of fat distribution that may help indicate a person’s overall health. People carrying more weight around their middle are at a higher risk of developing certain health conditions.
How WHR is Measured?
The measuring tape is used to measure the waist circumference, W, around your belly button. It is considered low risk for men who have waist circumference measurements of equal to 37 inches and lower. Women are at low risk if the waist measurement is equal to or lower than 31.5; while anything above falls under intermediate or high risk.
Then similarly, the widest part of your hip/buttocks, H, is measured.
Your waist-to-hip ratio is calculated as follows:

According to the World Health Organization (WHO), having a WHR of over 1.0 may increase the risk of developing conditions that relate to being overweight, including heart disease, type 2 diabetes and, infertility. Doctors frequently measure the waist-to-hip ratio to evaluate visceral fat which may indirectly indicate the risk for the possible onset of serious disease.
This may be the case even if other measures of being overweight, such as BMI are in a normal range.
CHART SHOWING WHR RATIOS AND RELATED HEALTH RISK
The WHO advice that a healthy WHR is:
- 0.85 or less for women
- 0.9 or less for men
The following chart shows how the WHO classifies the risk of being affected by weight-related health conditions according to WHR:
| Health risk | Men | Women |
| Low | 0.95 or lower | 0.80 or lower |
| Moderate | 0.96-1.0 | 0.81-0.85 |
| High | 1.0 or higher | 0.86 or higher |
The Resting Pulse
The heartbeat is often an indicator of your state of health.
Another marker that is used to help assess heart health is the resting pulse rate. This is calculated by taking your pulse first thing in the morning before getting out of bed. Place your fingers on your wrist and find your pulse. Count the number of beats in 30 seconds and multiple by two to reach your resting heart rate. Alternatively, you can count your beats in 60 seconds and not have to do any extra math.
Nowadays smartwatches and smartphones can detect your pulse at all times, even when you are asleep. Thus, you can get the resting pulse reading as soon as you are awake. Another alternative is to use a blood pressure meter.
A resting pulse of 60 to 100 is considered normal, but athletes and extremely fit people may have a rate lower than 60, indicating an even more efficient and healthy heart. If you notice that your resting pulse is almost always pushing above the upper limit, then it is time to consult your doctor.
Other health markers are used together with the resting pulse to indicate a more complete picture of your state of heart, kidney and, liver health. The doctor will extract your blood specimen and conduct laboratory tests to measure your blood glucose levels during fasting and post meals. These measurements will be collated with your blood pressure, and weight measurements, cholesterol levels, and other blood indicators such as hemoglobin and mineral content, will help indicate the state of your liver and kidneys and how healthy your heart is .
Blood Pressure
 Blood Pressure Meter
Blood pressure measures the amount of pressure exerted in arteries and veins as blood circulates the body. The higher the number, the more pressure there is, which can indicate stress or even potential plaque problems in arteries, problems with the heart, or extreme stress. One in three adults has high blood pressure.
Blood pressure is measured in systolic (top) and diastolic (bottom) numbers. A normal, healthy reading for a young adult is considered to be 120/80 or lower. Stage 1 high blood pressure or pre-hypertension, is defined as a systolic measurement of 130-139 over a diastolic reading of 80-89. As numbers get higher from there, it is often diagnosed that you are in a more serious stage of hypertension (high blood pressure).
You can check your blood pressure at home using a digital cuff that you secure on your left arm, around your bicep. These may not be as precise as in a doctor’s clinic. But using the same cuff at home regularly to measure blood pressure can indicate increases or decreases over time.
The following charts act as a guide to the blood pressure goals you should achieve.
The blood pressure measurement meter also gives the pulse reading. As mentioned earlier, if the readings show an upward trend, it is time to see your doctor.
BLOOD PRESSURE CHART BY AGE
| AGE GROUP | MINIMUM | MAXIMUM | NORMAL |
| 1-12 months | 75/50 | 110/75 | 90/60 |
| 1-5 years | 80/55 | 110/79 | 95/65 |
| 6 – 13 years | 90/60 | 115/80 | 105/70 |
| 14 -19 years | 105/73 | 120/81 | 117/77 |
| 20-24 years | 108/75 | 132/83 | 120/79 |
| 25 -29 years | 109/76 | 133/84 | 121/80 |
| 30-34 years | 110/77 | 134/85 | 122/81 |
| 35-39 years | 111/78 | 135/86 | 123/82 |
| 40-44 years | 112/79 | 137/87 | 125/83 |
| 45-49 years | 115/80 | 139/88 | 127/84 |
| 50-54 years | 116/81 | 142/89 | 129/85 |
| 55 -59 years | 118/82 | 144/90 | 131/86 |
| 60-64 years | 121/83 | 147/91 | 134/87 |
BLOOD PRESSURE CHART BY AGE AND GENDER
| AGE GROUP | FEMALE/mmHg | MALE/mmHg |
| 15-18 | 117/77 | 120/79 |
| 19-24 | 120/79 | 120/85 |
| 25-29 | 120/80 | 121/80 |
| 30-35 | 122/81 | 123/82 |
| 36-39 | 123/82 | 124/83 |
| 40-45 | 124/83 | 125/83 |
| 46-50 | 126/84 | 127/84 |
| 51-55 | 129/85 | 128/85 |
| 56-60 | 130/86 | 131/87 |
| 60 ++ | 134/87 | 135/88 |
Blood Glucose Level
 Blood Glucometer
What is the normal blood sugar range?
People with diabetes have to test their blood glucose at home as a matter of routine regularly. Another health marker is the glucose level measurement. A normal, healthy fasting glucose range within 70 to 99 mg/dL (3.9 to 5.5 mmol/L). This is taken 8-12 hours after the last eating or drinking, normally first thing in the morning.
A blood sugar level less than 140 mg/dL (7.8 mmol/L) is normal. A reading of more than 200 mg/dL (11.1 mmol/L) after two hours indicates diabetes. A reading between 140 and 199 mg/dL (7.8 mmol/L and 11.0 mmol/L) indicates prediabetes.
A stressful lifestyle, an unbalanced diet, lack of exercise, lack of sleep, dehydration; can increase fasting glucose levels. No matter what causes the increase, blood glucose levels are a great indicator of health.
Relative Fat Mass (RFM)
Researchers are looking for better ways to uniformly measure body fat that are better than BMI. The relative fat mass is still being studied, but one which some researchers claim is more relevant. RFM is easy to calculate and has slightly different formulas applied for men and women. The final numbers will classify people more accurately, compared with BMI.
Conclusion
Health practitioners will continue to use BMI to measure obesity and the state of health of patients. BMI will still be the first tool to categorize obesity. While BMI has its useful applications, it only gives you a limited perspective on how healthy you may (or may not) be.
Can you sense what your body is telling you without the help of the health markers? Often the presence of hypertension and diabetes are asymptomatic. Their long presence may well be a silent killer.
Using the other health markers together presents a more realistic state of health, many of which can be self-monitored at home. With regular self -measurements, you can tell when the readings deviate from the norm and seek medical advice as soon as possible.
Knowing your health status at home gives a feeling of confidence in your wellbeing. It also offers you a more personal connection to your state of wellness. This allows you to be more responsible for your health and provides additional motivation to maintain your healthy lifestyle. Your wellness check-ups will be extended to annual checkups. By being proactive with your health, you can save your medical bills and spend more time on creating wealth as well as spending quality time with your family.
Click for Paleo Recipes